I’ve been toying with an idea for a while now, and I finally decided to put it to the test. My curiosity revolves around the “trade the trend” strategy, specifically by following Sector SPDR ETFs.
For those unfamiliar, the “trade the trend” strategy is a trading approach that involves identifying and capitalizing on prevailing market trends. As described by HowToTrade.com, this strategy relies on spotting the direction in which a market is moving and making trades that align with that trend. The goal is to ride the trend for as long as possible to maximize profit.
However, I wanted to add a twist to this strategy. Imagine we’re in a bull market, a period during which prices of securities or assets are rising or expected to rise. In simpler terms, everyone is saying the stocks are going up. My idea is to rank the ETFs by their performance in the previous month and invest a weighted amount in each sector.
The weight ratio by grand total is a formula used to express the proportion of a part relative to the grand total. It is calculated by dividing the weight of the part by the grand total weight, then multiplying by 100 to get a percentage. This shows how significant each part is within the whole.
Let’s see an example of weighting with a grand total investment of 1,000:
- Company A – 100
- Company B – 150
- Company C – 50
- Company D – 250
- Company E – 450
Grand Total Investment = 100 + 150 + 50 + 250 + 450 = 1,000.
Now, to compute the weight ratios for each company:
- Company A: Weight Ratio = (100/1,000) × 100 = 10%
- Company B: Weight Ratio = (150/1,000) × 100 = 15%
- Company C: Weight Ratio = (50/1,000) × 100 = 5%
- Company D: Weight Ratio = (250/1,000) × 100 = 25%
- Company E: Weight Ratio = (450/1,000) × 100 = 45%
What this means is that from the monthly available amount, 10% of it will be invested in Company A, 15% in Company B, 5% in Company C, 25% in Company D, and 45% in Company E.
Every month, the rank will be recalculated, and specific amounts from the monthly available amount will again be invested according to the calculated weight based on the performance of each ETF in the previous month.
Now, let’s see a real world example with the Sector SPDR ETFs.
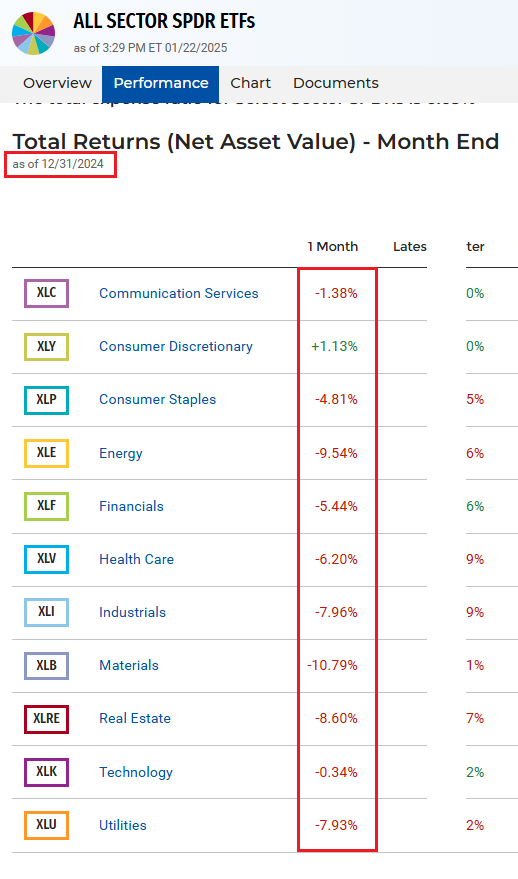
According to SPDR page, December 31, 2024, monthly performance for each sector is detailed below:
After working some magic with Power Query, I generated the ranking below. Keep in mind: lower ranks indicate poorer performance.
| Symbol | Sector | 1 Month | Rank | Ratio of grand total |
| XLB | Materials | -10.79% | 1 | 1.52% |
| XLE | Energy | -9.54% | 2 | 3.03% |
| XLRE | Real Estate | -8.60% | 3 | 4.55% |
| XLI | Industrials | -7.96% | 4 | 6.06% |
| XLU | Utilities | -7.93% | 5 | 7.58% |
| XLV | Health Care | -6.20% | 6 | 9.09% |
| XLF | Financials | -5.44% | 7 | 10.61% |
| XLP | Consumer Staples | -4.81% | 8 | 12.12% |
| XLC | Communication Services | -1.38% | 9 | 13.64% |
| XLK | Technology | -0.34% | 10 | 15.15% |
| XLY | Consumer Discretionary | 1.13% | 11 | 16.67% |
Given the table, we need to allocate 16.67% of our available funds into the XLY ETF (Consumer Discretionary) and 1.52% into the XLB ETF (Basic Materials), and similarly for each sector.
If we have 1,000 to invest this month, the distribution would match the percentages listed in the final column:
| Symbol | Sector | Ratio of grand total | Monthly investment |
| XLB | Materials | 1.52% | 15.15 |
| XLE | Energy | 3.03% | 30.30 |
| XLRE | Real Estate | 4.55% | 45.45 |
| XLI | Industrials | 6.06% | 60.61 |
| XLU | Utilities | 7.58% | 75.76 |
| XLV | Health Care | 9.09% | 90.91 |
| XLF | Financials | 10.61% | 106.06 |
| XLP | Consumer Staples | 12.12% | 121.21 |
| XLC | Communication Services | 13.64% | 136.36 |
| XLK | Technology | 15.15% | 151.52 |
| XLY | Consumer Discretionary | 16.67% | 166.67 |
For this test, my focus is on the long-term performance of this investment strategy. I’ll be disregarding recent events like the fake Santa rally, new presidency, and the past two years of high returns, starting with data from December 2024 only.
My plan is to conduct this exercise every month, investing 1,000 each time using my Demo account in Interactive Brokers broker. I’ll be sharing monthly blog updates on the progress. As for the duration of this test – I’m not sure yet, I will let the Universe decide this 🙂
So here’s the January test investment of $1,000 into the 11 sectors:
| Symbol | Date/Time | Type | Quantity | Price | Invested | Commission |
| XLB | 2025-01-23, 09:30:00 | BUY | 0.1706 | 88.78 | -15.15 | -0.15 |
| XLC | 2025-01-23, 09:30:00 | BUY | 1.3821 | 98.6572354 | -136.35 | -1 |
| XLE | 2025-01-23, 09:30:00 | BUY | 0.3273 | 92.5500092 | -30.29 | -0.3 |
| XLF | 2025-01-23, 09:30:00 | BUY | 2.1001 | 50.5009533 | -106.06 | -1 |
| XLI | 2025-01-23, 09:30:00 | BUY | 0.429 | 141.26 | -60.6 | -0.61 |
| XLK | 2025-01-23, 09:30:00 | BUY | 0.6323 | 239.62 | -151.51 | -1 |
| XLP | 2025-01-23, 09:30:01 | BUY | 1.5725 | 77.08 | -121.21 | -1 |
| XLRE | 2025-01-23, 09:30:00 | BUY | 1.1019 | 41.2453762 | -45.45 | -0.45 |
| XLU | 2025-01-23, 09:30:00 | BUY | 0.9634 | 78.63 | -75.75 | -0.76 |
| XLV | 2025-01-23, 09:30:00 | BUY | 0.6372 | 142.649997 | -90.9 | -0.91 |
| XLY | 2025-01-23, 09:30:10 | BUY | 0.7251 | 229.83 | -166.65 | -1 |