Tag: Excel

  • CMDB Data Quality. Reconciling ServiceNow and Qualys information

    CMDB Data Quality. Reconciling ServiceNow and Qualys information

    Many organisations depend on Configuration Management Databases (CMDB) to keep track of their Configuration Items. However, the value of these systems/databases depends completely on the quality of the data inside them. If computers are retired but are still powered on and on the network, or if operating systems and IP addresses are not updated correctly (ideally by a discovery tool), the CMDB becomes unreliable. And when the information is old or obsolete, it becomes difficult to trust the database for daily operations (think Change or Incident Management), security decisions or audits.

    Issue

    Let’s say Company A is using ServiceNow CMDB to keep track of their end user computers. Even with strong ITIL processes in place, the information drifts over time. Retired computers or servers still appear as active, being found on the network after decommissioning completes. When this happens, vulnerability issues, support questions etc. appear.

    Reconciling solution

    Ideally, each company should have at least one discovery tool and only one must be considered as Master Data Management tool. If this is not the case and CMDB is manually updated, a practical way to improve accuracy is to compare the data from different tools and then update CMDB manually.

    Let’s also assume that our Company A uses Qualys for their vulnerability management but also relies on its discovery capabilities to get a view of their devices on the network. This discovery often detects computers that are misclassified in ServiceNow. By exporting a list of computers from ServiceNow and a discovery report from Qualys, it becomes possible to reconcile the two datasets. This comparison highlights mismatches, missing entries and duplicates.

    Solution

    Let’s assume we have the following report from Qualys:

    Qualys sample report.

    And the following from ServiceNow with current data in the CMDB:

    ServiceNow sample report.

    These Excel files are saved weekly into the same folder using the same file names: ServiceNow.xlsx and Qualys.xlsx.

    We’ll create a new Excel file called Reconciling ServiceNow and Qualys.xlsx. It can be placed in the same folder or anywhere else.

    We’ll load both ServiceNow.xlsx and Qualys.xlsx to Power Query as separate queries.

    After doing the basic transformations (renaming columns and ensuring proper data type is set) in both queries I ended with this:

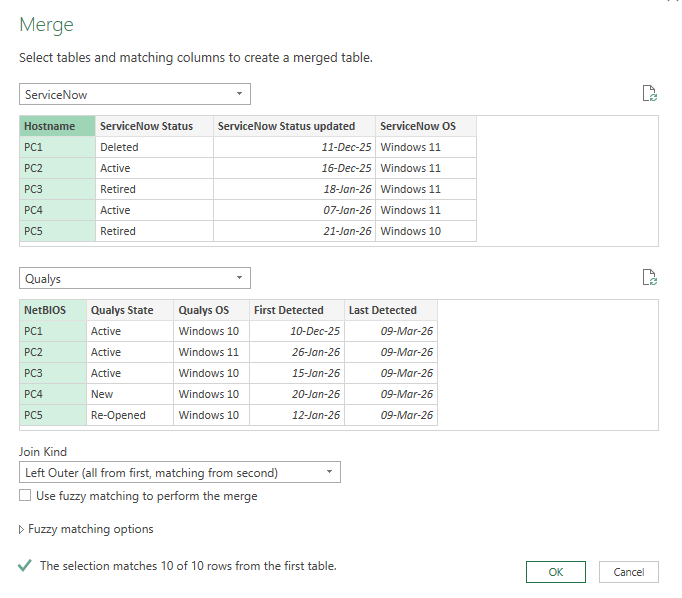
    Merging both queries into a new one using Hostname and NetBIOS columns:

    Expanding Qualys column ensuring NetBIOS column is not selected and also the original prefix is unchecked:

    The initial Merge1 query looks like this:

    Because I want to reconcile both the Status and OS fields, I will create a duplicate of this Merge1 query to save time and avoid repeating the merge again (remember – I’m lazy, so I’ll automate and reduce the steps/clicks as much as possible).

    I will rename the queries to more meaningful and descriptive names: Status mismatch and OS mismatch.

    Now, in the Status mismatch query I will remove unneeded OS columns . And in OS mismatch query I will remove ServiceNow Status, Qualys State, ServiceNow Status updated and First Detected columns. Here I only need the OS info and when discovery last saw the device.

    Focusing on the status mismatch issue, in the Status mismatch query I will add a conditional column that will check if the value in ServiceNow Status and Qualys Status columns is the same. If yes, then I will return OK, else Mismatch.

    This will create a new Status recon column with the information I need and with this, I have my status reconciliation query ready. I can see that between the 2 tools, Status matches only for PC2. Since this data is totally invented by me, this is fine to show this issue and how to find the discrepancies.

    Moving on to OS mismatch issue. In the OS mismatch query I will also add a conditional column that will check if the value in ServiceNow OS and Qualys OS columns is the same. If yes, then I will return OK, else Mismatch.

    This will create a new OS recon column with OK or Mismatch values again. I can see that between the 2 tools, OS matches only for 3 computers.

    Now, I only need the 2 mismatch queries in Excel as I will only want to verify these. So from the Home ribbon I will select Close & Load and then Close & Load To.

    In the Import Data box select Only Create Connection and click OK. Otherwise, all queries will be loaded to your Excel, each on separate worksheets.

    Now, from the right pane – Queries & Connections, right either Status mismatch or OS mismatch and select Load To.

    Select Table and New worksheet. This will add the data from the selected query to a new worksheet and will give the worksheet the same name.

    Repeat the “load to” operation for the other mismatch query. We’ll end up with a new worksheet with the data from the other query.

    We can safely delete Sheet1 or any other worksheet if we’ll not need it.

    Since this is a sample data with 10 rows only, imagine having reports with hundreds of thousands of rows. We will need to filter the recon columns to show Mismatch only, as everything else will be ok. So it would be best to filter out these rows directly, thus avoiding this additional step in Excel’s table.

    Opening Power Query again, I will filter out OK values from the recon columns in both queries.

    Closing and loading data to Excel, I can see my tables are not showing only mismatch rows so from here, I can move on with checking the processes and seeing what went wrong in the CMDB process and make the needed updates.

    Once the queries are configured and loaded into Excel, the weekly workflow becomes simple: export the two reports, place them in the same folder keeping same file names and refresh the Excel file using DataRefresh All. Power Query handles the rest, updating table if new data matches our recon conditions.

    The best thing? The export is done within minutes or seconds if this action is automated. Also, Excel work is also completed in seconds, so no more spending time to open different files and doing vlookups and so on.


  • What is an expense/budget category and how to use it

    What is an expense/budget category and how to use it

    An expense category is a group of expenses within the budget that helps you gain a better understanding of your spending habits and make informed decisions about your finances.

    You can think of it as a way to organize your expenses into different groups. This can help you identify areas where you are overspending and adjust your budget accordingly. While the fewer categories you have, the easier it will be to get insights from your budget, there are a few categories that are “a must”.

    Housing: This category includes expenses related to your home, such as rent, mortgage payments, property taxes, and home maintenance costs. Some people add utilities to this category, other don’t. Try and see what’s best for you.

    Transportation: This category includes expenses related to getting around, such as car payments, gas, maintenance, parking, tolls, ridesharing costs, and public transit.

    Food: This category includes expenses related to groceries, dining out, and other food-related expenses.

    Personal/Lifestyle: This category includes expenses related to personal care, entertainment, hobbies, and other lifestyle expenses.

    Insurance: This category includes expenses related to insurance premiums, such as home, car, and health insurance.

    Debt: This category includes expenses related to paying off debt, such as credit card payments, student loans, and other loans.

    Savings and Investment: This category includes expenses related to saving money and investing for the future.

    Following the Excel file from the Expense tracking spreadsheet post, our expense tracker/budget would like this:

    This Excel file can be downloaded from here. No subscription needed, it is available to download freely 🙂 just right click on the link and select save as.

    Featured image by Kelly Sikkema on Unsplash.


  • Expense tracking spreadsheet

    Expense tracking spreadsheet

    Continuing the previous post, How I took control of my money, let’s see how easy it is to see where your money is going.

    My long term idea is to write few articles with different topics but when you’ll put everything together, you’ll get a pretty nice money tracking and planning Excel file.

    Again, for any specific needs, ideas, help, feel free to get in touch with me.

    So, expense tracking. Very shortly, what it is and why it is needed?

    Expense tracking allows you to record and categorize expenses. Ideally, it is used as part of a budget but, for those who never had a budget or never tracked their income and expenses, simply tracking these will help a lot.

    To get into the habit of using it, a very simple spreadsheet is enough. Later on more things can be added to track other items as well, like categories and subcategories.

    Why you need it?

    1. It will allow you to take control of you finances.
    2. it will show you your bad spending habits.
    3. It will allow you to see spending patters and eliminate them. Did you ever think about how much you’re paying monthly by buying one coffee every day? Let’s do some math quickly: 2$ coffee x 20 business days avg x 12 months, would be 480$. Almost 500$ a year for coffee only!
    4. It will help you save money.
    5. Last but not least important, improving your or your family’s financial life, will improve your life in general and the relationship with your partner.

    While there are a lot of apps, online software and even pre-built Excel and Google Docs worksheets on the internet, if you need something really-really simple, consider the one below:

    Important notes:

    • To make this tracker bullet-proof accurate, at the end of each month you need to have the same amount in your account and in the spreadsheet. This is called “reconciling the ending balance in the spreadsheet with the actual account balance”.
    • To do this, you will need to have a line for the start of the month and another one for the end of the month.
    • Starting balance is the money you have in your account at the beginning of each month. You add this amount under Income column as a positive number.
    • Ending balance, similarly, is the money you have in your account at the end of the month. As you may have guessed already, these 2 are the same (you start the month with what you ended the previous month, no big logic here), with the exception of the date you start your spreadsheet. You add this amount also under Income column but, as a negative number.

    Let’s see below how would 2 months of income and expenses look like.

    Right, now that we know how it looks like, let’s see how balance is calculated.

    The very first time you start the spreadsheet, Balance field is equal to Income.

    Afterwards, every single line follows the same logic: the sum of previous balance (the row above) and Income, minus the expense amount.

    Clicking Show Formulas in Excel, this is how Balance formula looks like:

    Not so complicated, right? So using a spreadsheet like this will help you see where you’re spending your money. When you have few months of data you can start building some additional charts, pivot tables etc. to see this information in a nicer form. But we’ll reach it later, don’t worry about it now.

    For now, get into the habit of adding the information to this file at least weekly, if you cannot do it daily.

    Doing it daily, will take you less than 5 minutes. Doing it weekly or monthly, will take you hours to review your account and remember what was that for and the other one etc.

    Why it is important to regularly track your expenses? You will quickly spot patterns of where you’re overspending.

    To summarize, expense tracking is essential for budgeting and financial management a healthy financial lifestyle. It helps you understand where your money goes, identify bad spending habits, and take control of your financial decisions. Reconciling the ending balance in the spreadsheet with the actual account balance at the end of each month is necessary for accuracy (nobody likes reviewing receipts at the end of the month), and financial reporting later on. Regularly reviewing and analyzing tracked expenses helps you identify areas of overspending, improve the accuracy of each expense/vendor, identify errors and discrepancies.

    Again, if you have any question, let me know.

    The Excel file can be downloaded from here. No subscription needed, it is available to download freely 🙂 just right click on the link and select save as.

    Next article would be about categorizing expenses or creating subcategories to track specific spending areas.

    Featured image by Kenny Eliason on Unsplash.


  • How I took control of my money

    How I took control of my money

    Well, starting a new “topic” on this blog, personal finance related 🙂

    Just to be clear from the beginning, I’m not a finance guru, nor am I an expert in this field. Unless otherwise stated, what I will write here is my own experience with how I did this and that and how I think it helped me.

    In no way I’m telling you what to do or how to do it.

    So, money… My girlfriend said this several times in the past year: “I created a monster!”. But let’s start with the beginning…

    I love working with data! Big data, small data, doesn’t matter, give me data 😀 Personally, I think I have an Excel and Access files for almost everything that have “numbers” in my house. Car mileage and gas consumption, home asset management (as in, I know when I bought and how much I paid for every single piece of furniture or appliance I have in my house, including serial numbers), groceries (yes, every single grocery shopping receipt itemized by product, quantity, price, store), salary income, annual savings planner, rent and household expenses, hiking plan (km/day, pace, distance etc) for long trips or tracking climbing 13 floors at me previous office (don’t ask 😀), etc.

    Don’t really remember why, but about 8 years ago I encountered this template from Microsoft (it was uglier then but it had the same idea). In their words: “This Excel template can help you track your monthly budget by income and expenses. Input your costs and income, and any difference is calculated automatically so you can avoid shortfalls or make plans for any projected surpluses. Compare projected costs with actual costs to hone your budgeting skills over time.”

    Anyway, I started using it but gave up after few months, very few months. Various reasons but mainly lack of time and lack of support from my spouse in getting the expenses/receipts to the “finance” department.

    So this happened for some good 5-ish years. I start the template, spend some hours adding the subcategories and then few months later it’s a dead project.

    Time passed by and when a divorce added up, I started everything all over (new rent, appliances, furniture etc.) and every single month living paycheck to paycheck wondering where the hell is my money going!? I only bought this, that and something else, oh and that one, and the subscription I forgot about…

    But this time was different. I think because I had the psychological help of my girlfriend. She is quite good at saving and this motivated me!

    So I started reading books and listening all possible podcasts about personal finances. I remember like it was yesterday – Christmas vacation, 2021. I read 2 books in 1 week. I listened to tens if not hundreds short-like podcasts in the car during the car rides and every single time I went to the 🚽.

    I was astonished by the fact that there is an emergency fund, savings fund, investment, kids, car maintenance…. All these “funds” I had no idea about!

    3, or better 6, months of expenses in the emergency fund – yeah sure, I have money until the next paycheck…

    Car maintenance? Of course, I will pay from my paycheck when the time comes and then I will just suffer spending less until the next paycheck.

    Emergencies? To be honest, I don’t remember how I dealt with them 🙄

    Anyway, during that same vacation week, I built a new Excel file (yeah, I know) to add my daily expenses. A very simple file with date, expense details, amount, a category and subcategory. With each day/week that passed by, I was improving the file by adding several tables, sheets etc.

    Fast forward 1,5 years, I now have an Excel file where I track my income, plan my monthly expenses, add the real expenses and have the yearly overview of how I’m doing.

    So why my girlfriend said: “I created a monster!“? Because ever since I started reading about this 1,5 years ago, finance is my main topic of discussion with anyone, especially with my daughters. Every time I mention something finance related to her, I can see her rolling her eyes 🙂

    Anyway, trying to close this post, on which I worked for 2 weeks, writing small pieces whenever I had time. Getting down from spending 4000/year on Amazon to 100/year is a big achievement that I’m really proud of!

    To anyone who wants to see where their money is going to, just start with tracking your expenses. You’ll be amazed how easily 10-15 euros in-and-there add up to a big chunk.

    If you need any help starting up with an Excel file, contact me and I will try my best to help.