Category: Finance

  • N-days Close and Low + Buy on % Dip indicator on TradingView

    N-days Close and Low + Buy on % Dip indicator on TradingView

    Introduction

    I’m a lazy person and I’m not hiding it. I like automating tasks as much as possible so that I can work less do more in the same amount of time.

    This past weekend I met Pedro Aznar, who works at Banco de Sabadell and is also the director of Applesfera. We’ve discussed briefly about the bank and the exciting times it goes through now that the BBVA public trade offer is over and the bright future it has. I don’t own any banking stocks in my portfolio, but I thought of buying some shares of Banco de Sabadell. So, being lazy, for my long-term portfolio I like using Dollar Cost Averaging (DCA) strategy to avoid timing the market.

    The next day I was thinking if there is a way to use the same DCA strategy a bit different, as in taking profit of the short-term bad news or dips when prices can drop few percentage points in a matter of days.

    Doing what I like most, I quickly built an Excel file with a Power Query connection to Yahoo Finance API to get the Banco de Sabadell (SAB.MC on Yahoo Finance) stock prices for last 6 months and started doing some tests. To buy the dip I needed to decide on 2 things: 1) how big the dip is in days and 2) how big the dip is in percentages.

    For the days, I decided that last 5 sessions (aka trading days) should be enough to consider it a quick dip, since after few days the stock usually recovers if the company is good enough. I’ll not get into more details here, that’s why “usually” word is in italic 🙂

    For the dip percentages, it’s a bit tricky. One stock can go up or down 10% in 2 days and it’s ok, another stock can go up or down 2% and everything is taking profit like crazy. So I decided to make use of Average True Range (ATR) indicator expressed as a percentage of the current stock price. For example, the formula is: ATR/Close price*100. Considering January 16’s data, the ATR was 0.0711 and closed price was 3.24. Let’s play with the formula:

    ATR% = 0.0711 / 3.24 * 100 = 0.02194 * 100 = 2.194%

    I rounded 2.194% to 4% for SAB.MC stock considering that if it moves 4% in 5 days, it’s good enough to get a piece of the cake.

    Playing with the data in Excel I reached a point where I was satisfied with the results and needed a way to automate it. Again, 5 seconds to open Excel and refresh data is too long 🙂 so I decided to build an TradingView indicator that will give me BUY signals when price dips 4% from the highest closed price in the last 5 days.

    What the script does

    Inputs

    • Percentage below N‑days high (pct): the percent pullback from the recent N‑day high that defines the threshold.
    • Number of days to look back (sessions): how many daily bars are used to compute the recent close and low prices.
    • Days between BUY signals (cooldownBars): minimum number of bars (days) required between BUY signals. This is to avoid 5 buy signals in 5 days if the price drops like crazy every day.

    Data allignment

    • The script reads daily close and low prices via request.security, so the N‑day close/low are based on trading days even when you view intraday charts.
      • closeD: daily close price
      • lowD: daily low price

    Computed series

    • highestN: highest daily closeD over the last sessions days
    • lowestN: lowest daily lowD over the last sessions days

    BUY logic

    • triggerLevel: highestN * (1 – pct / 100) – the threshold price that is pct% below the N‑day high.
    • The script uses ta.crossunder(close, triggerLevel) as the BUY trigger. A BUY label is generated when the bar close crosses from above to below the threshold.
    • A cooldown prevents repeated BUYs. After a BUY signal fires, the script ignores further BUY conditions until cooldownBars bars have passed. The script records the bar index of the last BUY and compares the current bar index to enforce the cooldown.
    • Visuals
      • The indicator plots highestN (red), lowestN (green), and the threshold (orange).
      • When a BUY is allowed by the cooldown, the script places a single BUY label at the bar where the condition occurred.

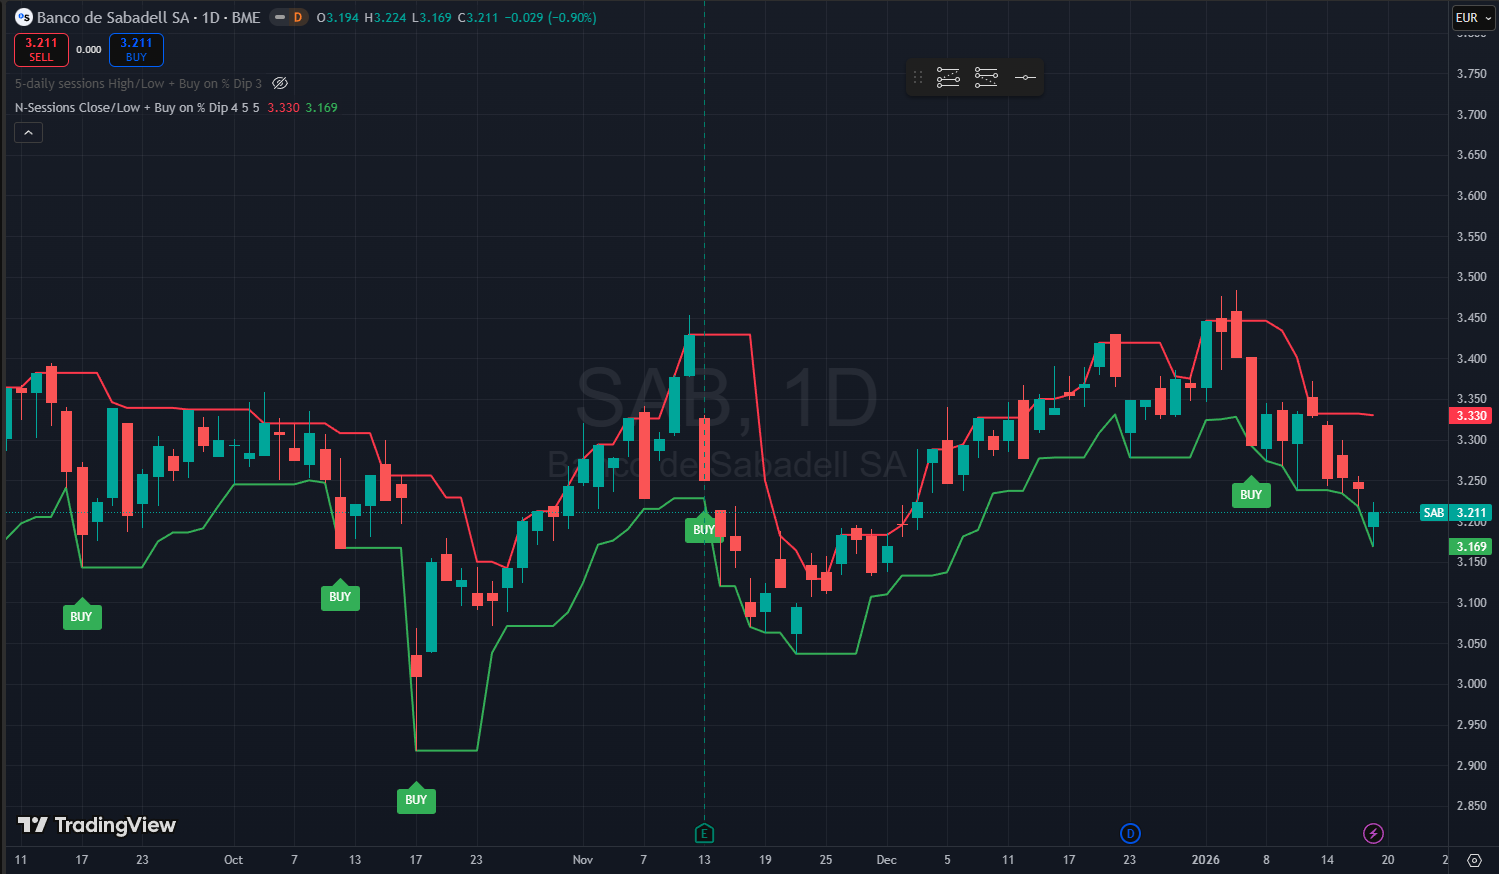
    The final chart looks like below:

    TradingView stock chart

    Why these design choices

    Daily alignment reduces noise. Using daily closes for the high avoids overreacting to intraday spikes that do not reflect session strength. The N‑day high becomes a stable reference that updates once per day.

    Threshold as a percentage of the N‑day high is intuitive. Traders commonly think in percentage pullbacks. Multiplying the N‑day high by (1 – pct/100) is simple, transparent, and easy to tune.

    Close confirmation reduces false signals. Requiring the close to cross under the threshold filters out transient wicks that briefly touch the level but do not represent a sustained move. *If you prefer immediate entries on touch, you can change buy condition ta.crossunder(close, triggerLevel) to low <= triggerLevel

    Cooldown prevents overtrading. Markets can linger below a threshold for several bars. The cooldown enforces a minimum spacing between signals so you evaluate each entry without being flooded by repeated alerts. This is especially useful on lower‑liquidity instruments or during volatile periods.

    Concrete example for Banco de Sabadell on BME using 4% and 5 sessions

    Input choices for the example:
    pct = 4
    sessions = 5
    cooldownBars = 5

    Step 1 Compute the 5‑day high

    Suppose the five most recent daily closes include a highest close of 3.372. That becomes highestN.

    Step 2 Compute the threshold

    • Formula: triggerLevel = highestN * (1 – pct / 100)
    • Numbers: triggerLevel = 3.372 * 0.96 = 3.23712
    • Displayed: the script will show the threshold around 3.237 if plotted and formatted to three decimals.

    Step 3 Interpret signals

    • Close‑based BUY: a BUY is generated only when a daily close crosses from above to below 3.237. If an intraday low dips to 3.169 but the bar closes above 3.237, the script will not generate a BUY because it requires close confirmation.
    • Cooldown example: if a BUY fires on day index 100, and cooldownBars = 5, the next BUY can only occur on day index 105 or later. Any close‑under events between 101 and 104 are ignored.

    How to tune the script for your trading style

    More conservative entries. Keep ta.crossunder(close, triggerLevel) and increase cooldownBars to 5–10 days. This reduces false positives and limits entries during choppy periods.

    More aggressive entries. Change the trigger to low <= triggerLevel to fire on the first touch. Reduce or remove the cooldown if you want every touch to be signaled.

    Adjust percentage and lookback.

    • Smaller pct (1–2%) yields more frequent signals near the recent high; larger pct (3–6%) waits for deeper pullbacks.
    • Shorter sessions (3–5) reacts faster to recent price action; longer sessions (10–20) smooths the reference and reduces sensitivity.

    The full script can be found below. You’ll need to start creating a new indicator in TradingView and paste the code to test it.

    // This Pine Script® code is subject to the terms of the Mozilla Public License 2.0 at https://mozilla.org/MPL/2.0/
    // © copyright https://vitciobanu.eu
    // script version: 4
    // script date: 2026.01.19
    
    //@version=6
    indicator("N-Sessions Close/Low + Buy on % Dip", overlay=true)
    
    // === User inputs ===
    pct      = input.float(title="Percentage below N-days high (e.g. 1 for 1%)", defval=1, minval=1, step=0.5)
    sessions = input.int(title="Number of days to look back", defval=5, minval=1, step=1)
    cooldownBars = input.int(title="Days between BUY signals", defval=5, minval=0, step=1)
    
    // === Use daily close/low prices regardless of chart timeframe ===
    closeD = request.security(syminfo.tickerid, "D", close, lookahead=barmerge.lookahead_off)
    lowD   = request.security(syminfo.tickerid, "D", low,   lookahead=barmerge.lookahead_off)
    
    // === N-session highest (based on daily close) / lowest (daily low) ===
    highestN = ta.highest(closeD, sessions)     // highest closed in last 'sessions' daily bars
    lowestN  = ta.lowest(lowD, sessions)        // lowest low in last 'sessions' daily bars
    
    // === Compute trigger level (not plotted) and BUY condition ===
    triggerLevel = highestN * (1 - pct / 100)
    buyCond = ta.crossunder(close, triggerLevel)
    
    // === Cooldown logic: allow a BUY only if cooldownBars have passed since last BUY ===
    var int lastBuyBar = na
    canBuy = false
    if buyCond
        if na(lastBuyBar) or (bar_index - lastBuyBar) >= cooldownBars
            canBuy := true
        else
            canBuy := false
    else
        canBuy := false
    
    // When a BUY is allowed, record the bar index
    if canBuy
        lastBuyBar := bar_index
    
    // === Plot the N-session close and low ===
    plot(highestN, title="N-session Close", color=color.red, linewidth=2, style=plot.style_line)
    plot(lowestN,  title="N-session Low",   color=color.green, linewidth=2, style=plot.style_line)
    
    // === Place a single BUY label per allowed triggering bar ===
    if canBuy
        labelText = "BUY"
        label.new(bar_index, triggerLevel, labelText, color=color.green, textcolor=color.white, style=label.style_label_up, yloc=yloc.belowbar, size=size.normal)

  • “Trade the Trend” Strategy – Summary

    “Trade the Trend” Strategy – Summary

    If you’re new to this post, start with the first post explaining the “Trade the Trend” Strategy. approach.

    In early December 2025, SPDR redesigned its website and removed the monthly sector performance tracking feature, so December’s data is unavailable. Still, I briefly analyzed performance using the data from January through November 2025.


    Investment Overview

    Investing monthly across the 11 Sector SPDR ETFs, the total amount invested was $11,084.


    Sector Allocation Summary

    ETFSectorTotal Invested% of Portfolio
    XLBMaterials754.766.81%
    XLCCommunication Services1,100.059.93%
    XLEEnergy971.708.77%
    XLFFinancials875.607.90%
    XLIIndustrials1,139.3510.28%
    XLKTechnology1,391.6612.55%
    XLPConsumer Staples862.997.78%
    XLREReal Estate683.956.17%
    XLUUtilities1,193.3610.77%
    XLVHealth Care1,055.159.52%
    XLYConsumer Discretionary1,055.759.53%
    Total11,084.31100%

    Monthly investments:


    End-of-Year Portfolio Performance

    The portfolio’s cost basis stands at $11,191.08, with an unrealized gain of $943.08, representing +8.43%.

    Dividends for 2025 are reported in the demo account only from July onward and were not reinvested. The reported dividend figures below reflect the available timeframe (July-December) rather than a full-year total.


    Best and Worst Performing Sectors

    Top Performers
    • XLK (Technology)
    • XLC (Comm Services)
    • XLV (Health Care)
    • XLI (Industrials)
    Underperformers
    • XLP (Consumer Staples)
    • XLRE (Real Estate)

  • “Trade the Trend” Strategy – November 2025 update

    “Trade the Trend” Strategy – November 2025 update

    If you’re new to this post, please check the first post to know what this is about.

    Sector SPDR ETFs page was updated with October data, so it’s time to update our numbers and buy more participations to the ETFs.

    This is how the portfolio looks like as of October 8th close:

    Based on the manual monthly investment ranking process, these are the investment amounts I’ll be placing orders for this month.

    UpdatedSymbolSector1 MonthRankMonthly investment
    10-Nov-25XLKTechnology6.58%1                                  200.00
    10-Nov-25XLVHealth Care3.57%2                                  180.00
    10-Nov-25XLUUtilities2.10%3                                  150.00
    10-Nov-25XLIIndustrials0.47%4                                  120.00
    10-Nov-25XLYConsumer Discretionary0.08%5                                  100.00
    10-Nov-25XLEEnergy-1.39%6                                     80.00
    10-Nov-25XLPConsumer Staples-2.68%7                                     70.00
    10-Nov-25XLFFinancials-2.84%8                                     40.00
    10-Nov-25XLCCommunication Services-3.02%9                                     30.00
    10-Nov-25XLREReal Estate-3.02%10                                     20.00
    10-Nov-25XLBMaterials-4.48%11                                     10.00

  • “Trade the Trend” Strategy – October 2025 update

    “Trade the Trend” Strategy – October 2025 update

    If you’re new to this post, please check the first post to know what this is about.

    Sector SPDR ETFs page was updated with September data, so it’s time to update our numbers and buy more participations to the ETFs.

    This is how the portfolio looks like as of October 8th close:

    Based on the manual monthly investment ranking process, these are the investment amounts I’ll be placing orders for this month.

    UpdatedSymbolSector1 MonthRankMonthly investment
    8-Oct-25XLKTechnology7.62%1                                  200.00
    8-Oct-25XLCCommunication Services6.69%2                                  180.00
    8-Oct-25XLUUtilities4.13%3                                  150.00
    8-Oct-25XLYConsumer Discretionary3.62%4                                  120.00
    8-Oct-25XLIIndustrials1.94%5                                  100.00
    8-Oct-25XLVHealth Care1.78%6                                     80.00
    8-Oct-25XLREReal Estate0.41%7                                     70.00
    8-Oct-25XLFFinancials0.14%8                                     40.00
    8-Oct-25XLEEnergy-0.27%9                                     30.00
    8-Oct-25XLPConsumer Staples-2.27%10                                     20.00
    8-Oct-25XLBMaterials-2.36%11                                     10.00

  • “Trade the Trend” Strategy – September 2025 update

    “Trade the Trend” Strategy – September 2025 update

    If you’re new to this post, please check the first post to know what this is about.

    Sector SPDR ETFs page was updated with August data, so it’s time to update our numbers and buy more participations to the ETFs.

    This is how the portfolio looks like as of September 11th close:

    Based on the manual monthly investment ranking process, these are the investment amounts I’ll be placing orders for this month.

    UpdatedSymbolSector1 MonthRankMonthly investment
    12-Sep-25XLVHealth Care5.37%1200
    12-Sep-25XLBMaterials5.16%2180
    12-Sep-25XLYConsumer Discretionary4.65%3150
    12-Sep-25XLCCommunication Services3.65%4120
    12-Sep-25XLEEnergy3.61%5100
    12-Sep-25XLFFinancials3.11%680
    12-Sep-25XLREReal Estate2.17%770
    12-Sep-25XLPConsumer Staples1.23%840
    12-Sep-25XLIIndustrials0.00%930
    12-Sep-25XLKTechnology-0.03%1020
    12-Sep-25XLUUtilities-1.59%1110

  • “Trade the Trend” Strategy – August 2025 update

    “Trade the Trend” Strategy – August 2025 update

    If you’re new to this post, please check the first post to know what this is about.

    Sector SPDR ETFs page was updated with July data, so it’s time to update our numbers and buy more participations to the ETFs.

    This is how the portfolio looks like as of August 12th close:

    Based on the manual monthly investment ranking process, these are the investment amounts I’ll be placing orders for this month.

    UpdatedSymbolSector1 MonthRank 1 MonthMonthly investment
    13-Jul-2531-07-25Utilities4.93%1                                  200.00
    13-Jul-2531-07-25Technology3.63%2180.00
    13-Jul-2531-07-25Industrials3.00%3                                  150.00
    13-Jul-2531-07-25Energy2.80%4                                  120.00
    13-Jul-2531-07-25Consumer Discretionary1.85%5100.00
    13-Jul-2531-07-25Financials-0.05%6                                     80.00
    13-Jul-2531-07-25Materials-0.09%7                                     70.00
    13-Jul-2531-07-25Real Estate-0.10%840.00
    13-Jul-2531-07-25Communication Services-1.01%9                                     30.00
    13-Jul-2531-07-25Consumer Staples-1.49%10                                     20.00
    13-Jul-2531-07-25Health Care-3.26%11                                     10.00

  • “Trade the Trend” Strategy – July 2025 update

    “Trade the Trend” Strategy – July 2025 update

    If you’re new to this post, please check the first post to know what this is about.

    Sector SPDR ETFs page was updated with June data, so it’s time to update our numbers and buy more participations to the ETFs.

    This is how the portfolio looks like as of July 9th close:

    Based on the manual monthly investment ranking process, these are the investment amounts I’ll be placing orders for this month.

    UpdatedSymbolSector1 MonthRank 1 MonthMonthly investment
    30-06-25XLKTechnology9.70%1                                  200.00
    30-06-25XLCCommunication Services7.12%2                                  180.00
    30-06-25XLEEnergy4.42%3                                  150.00
    30-06-25XLIIndustrials3.44%4                                  120.00
    30-06-25XLFFinancials3.04%5                                  100.00
    30-06-25XLBMaterials2.00%680.00
    30-06-25XLVHealth Care1.85%7                                     70.00
    30-06-25XLYConsumer Discretionary1.70%8                                     40.00
    30-06-25XLUUtilities0.03%9                                     30.00
    30-06-25XLREReal Estate-0.21%10                                     20.00
    30-06-25XLPConsumer Staples-1.87%11                                     10.00


  • “Trade the Trend” Strategy – June 2025 update

    “Trade the Trend” Strategy – June 2025 update

    If you’re new to this post, please check the first post to know what this is about.

    Sector SPDR ETFs page was updated with May data, so it’s time to update our numbers and buy more participations to the ETFs.

    This is how the portfolio looks like as of June 9th close:

    Based on the manual monthly investment ranking process, these are the investment amounts I’ll be placing orders for this month.

    UpdatedSymbolSector1 MonthRankMonthly investment
    31-05-25XLKTechnology9.92%1                                  200.00
    31-05-25XLIIndustrials8.82%2                                  180.00
    31-05-25XLYConsumer Discretionary8.48%3                                  150.00
    31-05-25XLCCommunication Services6.20%4                                  120.00
    31-05-25XLFFinancials4.42%5                                  100.00
    31-05-25XLUUtilities3.88%6                                     80.00
    31-05-25XLBMaterials2.85%7                                     70.00
    31-05-25XLEEnergy1.38%8                                     40.00
    31-05-25XLPConsumer Staples1.22%9                                     30.00
    31-05-25XLREReal Estate0.98%10                                     20.00
    31-05-25XLVHealth Care-5.54%11                                     10.00


  • “Trade the Trend” Strategy – May 2025 update

    “Trade the Trend” Strategy – May 2025 update

    If you’re new to this post, please check the first post to know what this is about.

    Sector SPDR ETFs page was updated with April data, so it’s time to update our numbers and buy more participations to the ETFs.

    This is how the portfolio looks like as of May 9th close:

    Based on the manual monthly investment ranking process, these are the investment amounts I’ll be placing orders for this month.

    UpdatedSymbolSector1 MonthRank 1 MonthMonthly investment
    30-04-25XLKTechnology1.82%1                                  200.00
    30-04-25XLPConsumer Staples0.28%2                                  180.00
    30-04-25XLIIndustrials0.19%3                                  150.00
    30-04-25XLUUtilities0.09%4                                  120.00
    30-04-25XLYConsumer Discretionary-0.08%5                                  100.00
    30-04-25XLCCommunication Services-0.95%6                                     80.00
    30-04-25XLREReal Estate-1.21%7                                     70.00
    30-04-25XLFFinancials-2.08%8                                     40.00
    30-04-25XLBMaterials-2.33%9                                     30.00
    30-04-25XLVHealth Care-3.71%10                                     20.00
    30-04-25XLEEnergy-13.83%11                                     10.00


  • “Trade the Trend” Strategy – April 2025 update

    “Trade the Trend” Strategy – April 2025 update

    If you’re new to this post, please check the first post to know what this is about.

    Sector SPDR ETFs page was updated with March data, so it’s time to update our numbers and buy more participations to the ETFs.

    Since last update, here is how the portfolio looks like as of April 10th close (don’t forget about Trump’s tariffs messing up the markets lately 🙂 ):

    Following the process of the manual monthly investment based on rank, here is how the SPDR ETFs looked like at the end of March 2025 and the monthly investment amount I will put orders for.

    During this interesting tariffs-time, all but Energy and Utilities sectors were negative. This is a good time to buy 🙂

    UpdatedSymbolSector1 MonthRankMonthly investment
    31-03-25XLEEnergy3.45%1200
    31-03-25XLUUtilities0.26%2180
    31-03-25XLPConsumer Staples-1.15%3150
    31-03-25XLVHealth Care-1.69%4120
    31-03-25XLREReal Estate-2.42%5100
    31-03-25XLBMaterials-2.73%680
    31-03-25XLIIndustrials-3.60%770
    31-03-25XLFFinancials-4.21%840
    31-03-25XLCCommunication Services-5.19%930
    31-03-25XLYConsumer Discretionary-8.31%1020
    31-03-25XLKTechnology-8.33%1110

    Based on above table, I will proceed with buying the ETFs with the amounts listed in the Monthly investment column.