If you’re new to this post, start with the first post explaining the “Trade the Trend” Strategy. approach.
In early December 2025, SPDR redesigned its website and removed the monthly sector performance tracking feature, so December’s data is unavailable. Still, I briefly analyzed performance using the data from January through November 2025.
Investment Overview
Investing monthly across the 11 Sector SPDR ETFs, the total amount invested was $11,084.
Sector Allocation Summary
| ETF | Sector | Total Invested | % of Portfolio |
|---|---|---|---|
| XLB | Materials | 754.76 | 6.81% |
| XLC | Communication Services | 1,100.05 | 9.93% |
| XLE | Energy | 971.70 | 8.77% |
| XLF | Financials | 875.60 | 7.90% |
| XLI | Industrials | 1,139.35 | 10.28% |
| XLK | Technology | 1,391.66 | 12.55% |
| XLP | Consumer Staples | 862.99 | 7.78% |
| XLRE | Real Estate | 683.95 | 6.17% |
| XLU | Utilities | 1,193.36 | 10.77% |
| XLV | Health Care | 1,055.15 | 9.52% |
| XLY | Consumer Discretionary | 1,055.75 | 9.53% |
| Total | 11,084.31 | 100% |
Monthly investments:

End-of-Year Portfolio Performance

The portfolio’s cost basis stands at $11,191.08, with an unrealized gain of $943.08, representing +8.43%.
Dividends for 2025 are reported in the demo account only from July onward and were not reinvested. The reported dividend figures below reflect the available timeframe (July-December) rather than a full-year total.

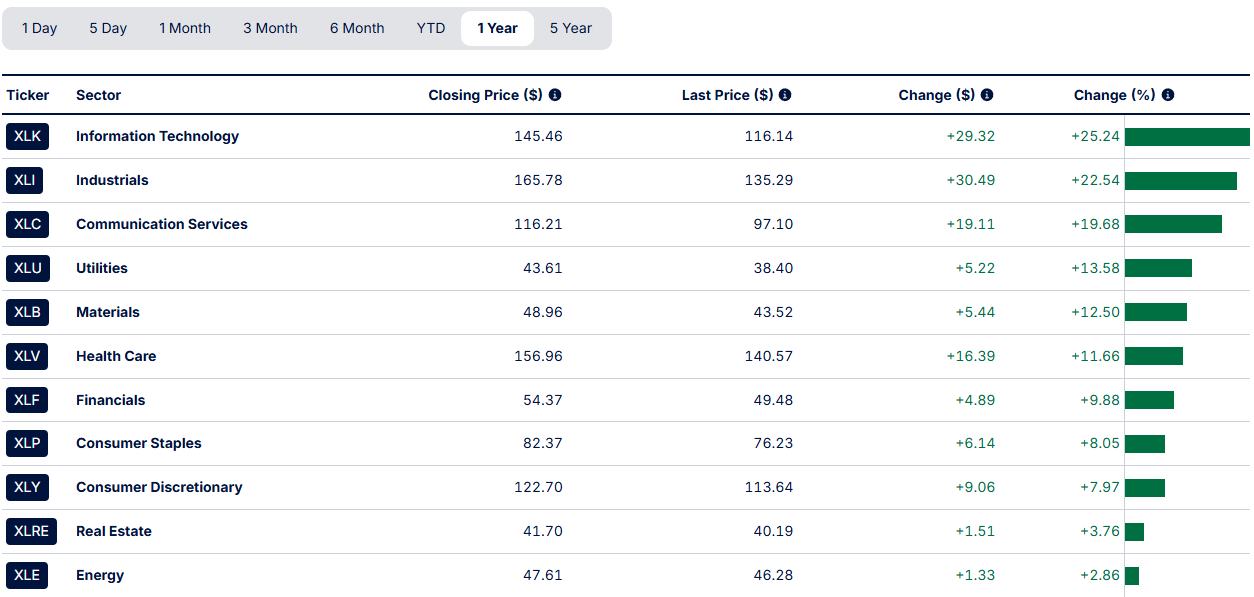
Best and Worst Performing Sectors
Top Performers
- XLK (Technology)
- XLC (Comm Services)
- XLV (Health Care)
- XLI (Industrials)
Underperformers
- XLP (Consumer Staples)
- XLRE (Real Estate)
Leave a Reply