If you’re new to this post, please check the first post to know what this is about.
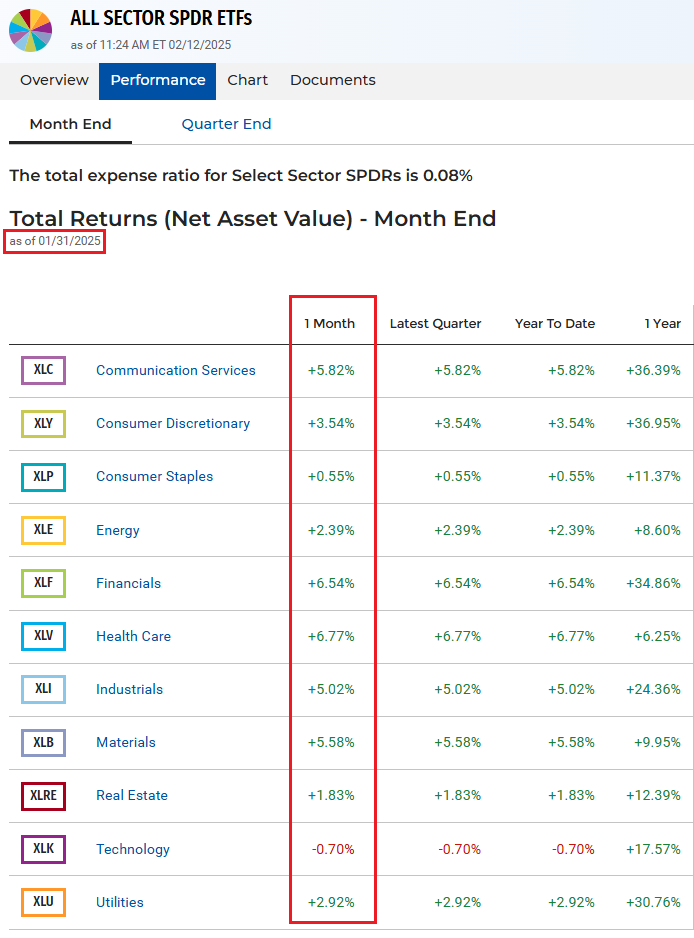
Since Sector SPDR ETFs page was updated with January data, let’s update our numbers and buy more participations to our ETFs.
Since last update, here is how the portfolio looks like today:
| Symbol | Quantity | Cost Price | Cost Basis | Close Price | Value | Unrealized P/L |
| XLB | 0.1706 | 89.67 | 15.30 | 89.26 | 15.23 | (0.07) |
| XLC | 1.3821 | 99.38 | 137.35 | 103.37 | 142.87 | 5.52 |
| XLE | 0.3273 | 93.48 | 30.59 | 91.24 | 29.86 | (0.73) |
| XLF | 2.1001 | 50.98 | 107.06 | 51.54 | 108.24 | 1.18 |
| XLI | 0.429 | 142.67 | 61.21 | 138.61 | 59.46 | (1.75) |
| XLK | 0.6323 | 241.20 | 152.51 | 236.33 | 149.43 | (3.08) |
| XLP | 1.5725 | 77.72 | 122.21 | 80.61 | 126.76 | 4.55 |
| XLRE | 1.1019 | 41.66 | 45.90 | 42.26 | 46.57 | 0.67 |
| XLU | 0.9634 | 79.42 | 76.51 | 79.39 | 76.48 | (0.03) |
| XLV | 0.6372 | 144.08 | 91.81 | 146.03 | 93.05 | 1.24 |
| XLY | 0.7251 | 231.21 | 167.65 | 223.78 | 162.26 | (5.39) |
| TOTAL | 1,008.10 | 1,010.21 | 2.11 |
I’ve made some changes to how I calculate the weight from a grand total. I still don’t like how it works, especially when there are negative and positive numbers. Until I will have an idea about this, I will just do nothing with the ETFs that are in negative in the previous month.
So here is January 2025 data for SPDR ETFs and the $1,000 investment into the 11 sectors that I will do now:
| Symbol | Sector | Last Month | Rank | Ratio of grand total | Monthly investment |
| XLK | Technology | -0.70% | 1 | -1.74% | (17.39) |
| XLP | Consumer Staples | 0.55% | 2 | 1.37% | 13.66 |
| XLRE | Real Estate | 1.83% | 3 | 4.55% | 45.45 |
| XLE | Energy | 2.39% | 4 | 5.94% | 59.36 |
| XLU | Utilities | 2.92% | 5 | 7.25% | 72.53 |
| XLY | Consumer Discretionary | 3.54% | 6 | 8.79% | 87.93 |
| XLI | Industrials | 5.02% | 7 | 12.47% | 124.69 |
| XLB | Materials | 5.58% | 8 | 13.86% | 138.60 |
| XLC | Communication Services | 5.82% | 9 | 14.46% | 144.56 |
| XLF | Financials | 6.54% | 10 | 16.24% | 162.44 |
| XLV | Health Care | 6.77% | 11 | 16.82% | 168.16 |
Remember, Technology will have no investment this month. Need to come up with a better idea on how to calculate the weight of each sector, even when some of them are in negative. If you have any ideas, please drop a comment.